SA Water Resevoir Data Analysis
A detailed analysis of resevoir volume changes in SA between 2019-2020
RoleApplication Developer
Data AnalysisD3Data Visualization
TeamDevelopment (Personal)
Report to N/A
DurationMarch 20203 months
Background
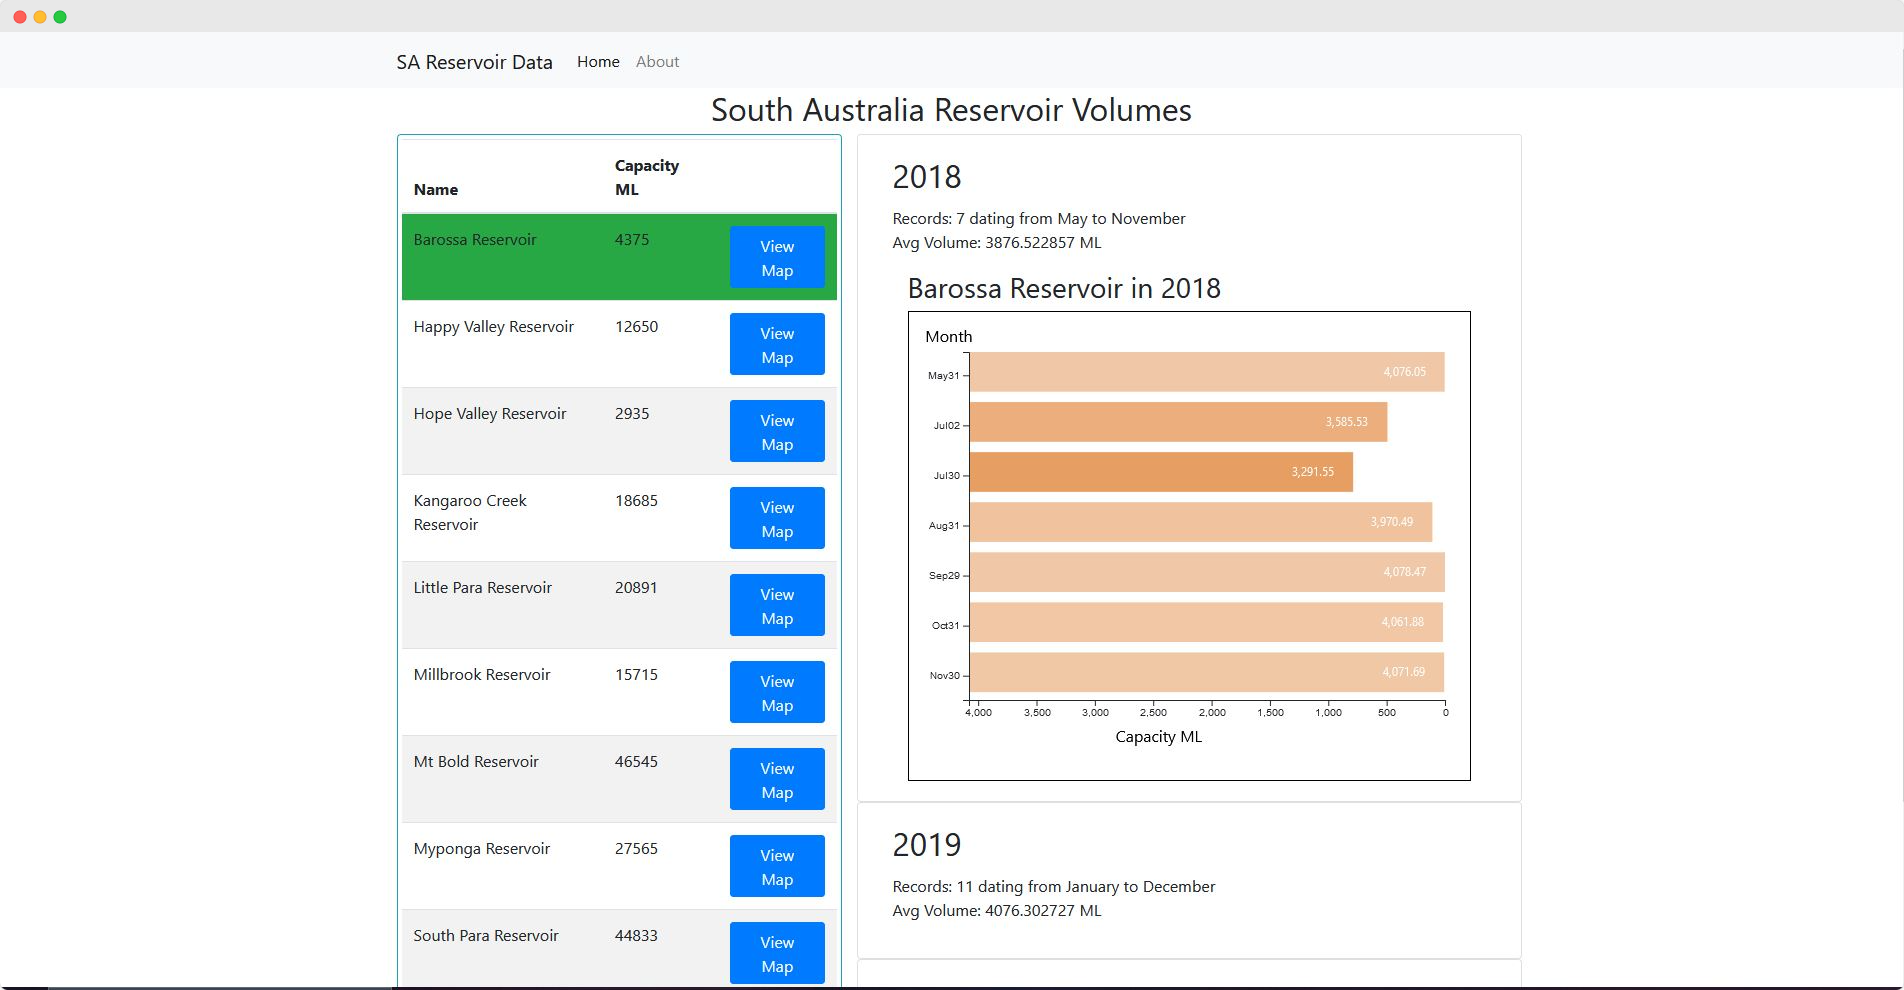
The goal of this project to analyse the water volume changes in each reservoirs of South Australia during the period betwen 2019 to 2020.
The data is provided by SA Water, the government agency and the analysed data is plotted beautifully through D3 framework to create charts and graphs.
Problems
The data are stored in JSON which makes it harder for analysts or general public to view how much water data has changes within the year.
Solutions
The data is then formatted, categorised and plotted beautifully on graph, created with D3 framework.
This help people to see how much water volume has changed easily.
Technologies Used
- HTML, CSS for Frontend Components, jQuery and D3 to decorate and make the website alive
- .Net for all backend components